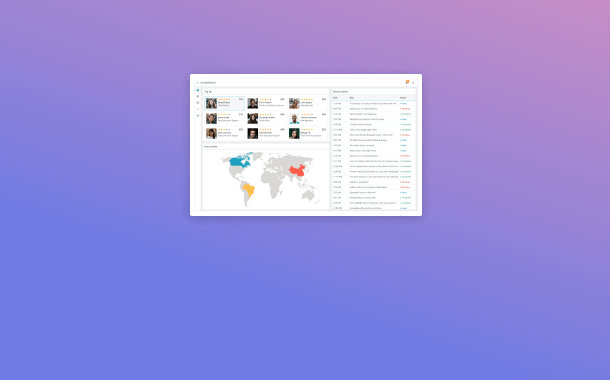
Webix GeoChart is a visual data component for creating area maps with geo-related data. With this widget you get all the visual features of Google GeoChart. In addition, you can load and template its data in a convenient Webix way.
You can easily access all Google GeoДhart settings via this widget. For example, you can define the display mode, a specific map area to show and a chart legend. You can also paint you GeoChart in your favourite color scheme.
You can load your data into GeoChart in any format supported by Webix (e.g. JSON, XML, CSV) and the widget will automatically convert it to the format expected by Google GeoChart.
You can add, update and delete data items in GeoChart like in any other Webix data widget. You can also filter the items to display only the relevant data set.
Click on the radio buttons to filter the data. Use the form below the GeoChart to update its data.
GeoChart – Part of Webix UI Library
GeoChart functionality
GeoChart – Part of Webix UI Library