- Button
- Calendar
- Checkbox
- Checksuggest
- Colorboard
- Colorpicker
- Color Selector
- Combo
- Counter
- DatePicker
- DateRange
- DateRangePicker
- TimeBoard
- DateRangeSuggest
- DataSuggest
- DoubleList
- GridSuggest
- Icon
- Fieldset
- FormInput
- Label
- Mentionsuggest
- Multicombo
- Multiselect
- MultiSuggest
- Multitext
- Pager
- Radio
- RangeSlider
- RichSelect
- RichText
- Search
- Select
- Segmented
- Slider
- Suggest List
- Switch Button
- Tabbar
- Text
- Texthighlight
- Textarea
- Toggle
- Uploader
JavaScript Charts widgets for data visualization and analytics
Webix JS is a graphing and charting library for designing outstanding analytical web applications and custom UIs. This software product allows implementing dynamic data visualization with smooth animation and several interactive features. Webix development team followed the top-notch material design trends to create a variety of ready-to-use responsive widgets.
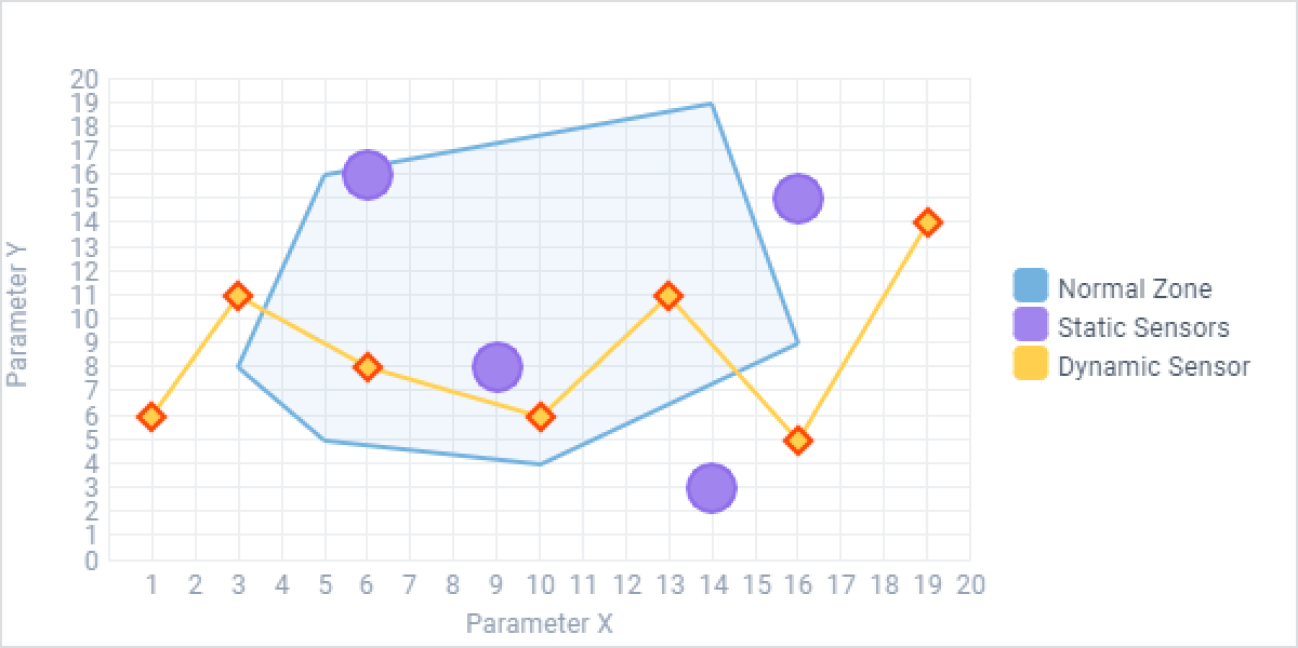
JavaScript Charts widget is a highly-customizable set of JS charts (line, spline, area, bar, pie, 3D-pie, donut, scatter, radar, etc.). The interactive UI controls include 14 types of charts and data tools such as sorting, filtering, and grouping.
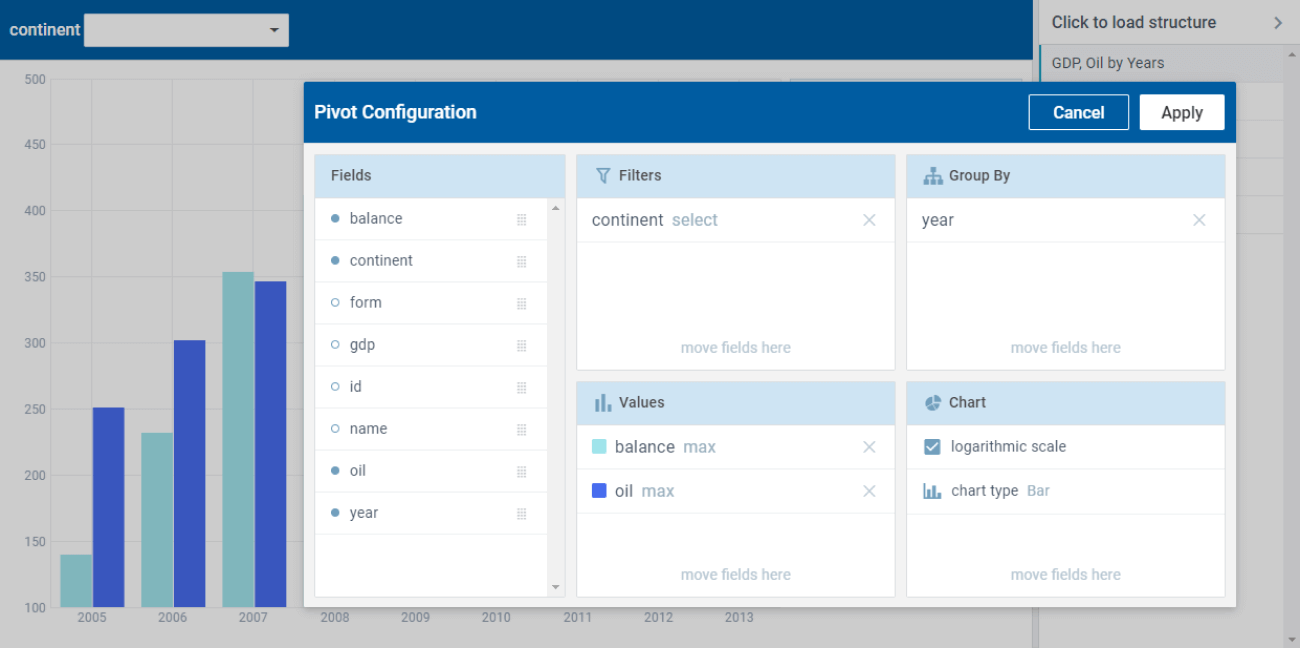
Pivot Chart JavaScript UI widget facilitates smooth data aggregation and visualization by means of different chart types and data-structure sets. Data export feature allows converting information in PDF, PNG, Excel, and CVS formats. The widget provides seamless back-end and front-end integration.
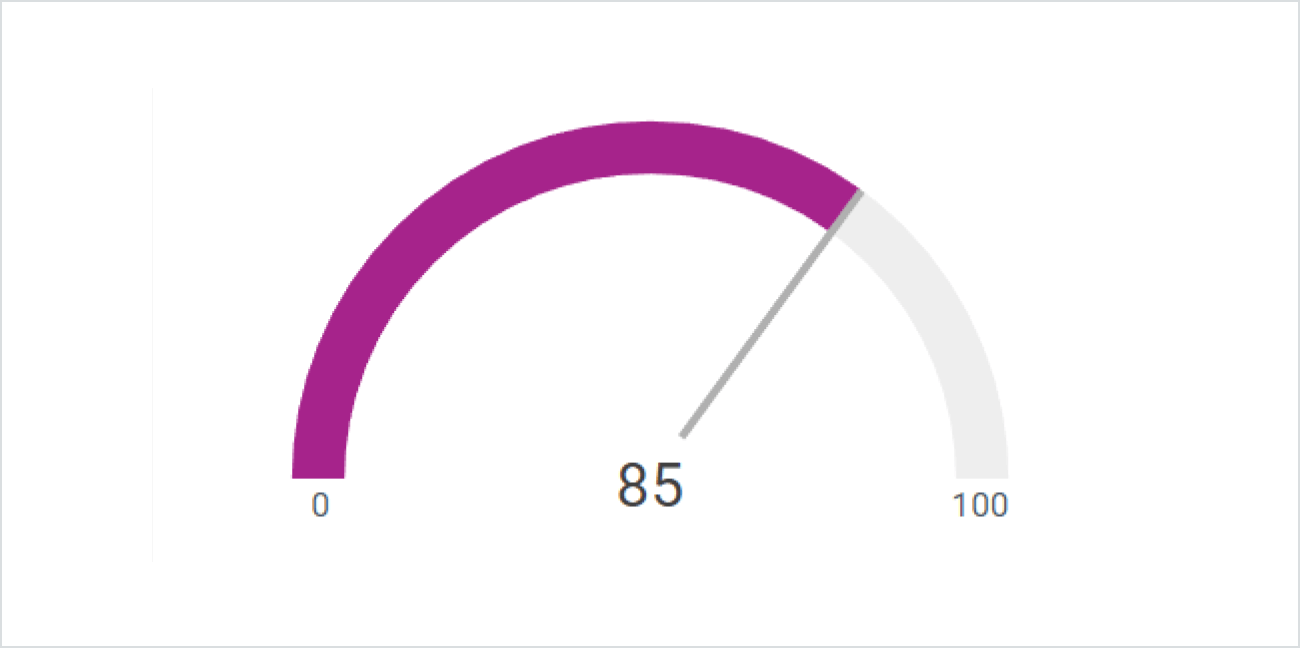
Gage (Gauge) JavaScript widget is aimed to display dynamic data with the help of smooth and interactive animation. The widget enables to set up custom labels, placeholders, and dynamic colour change.
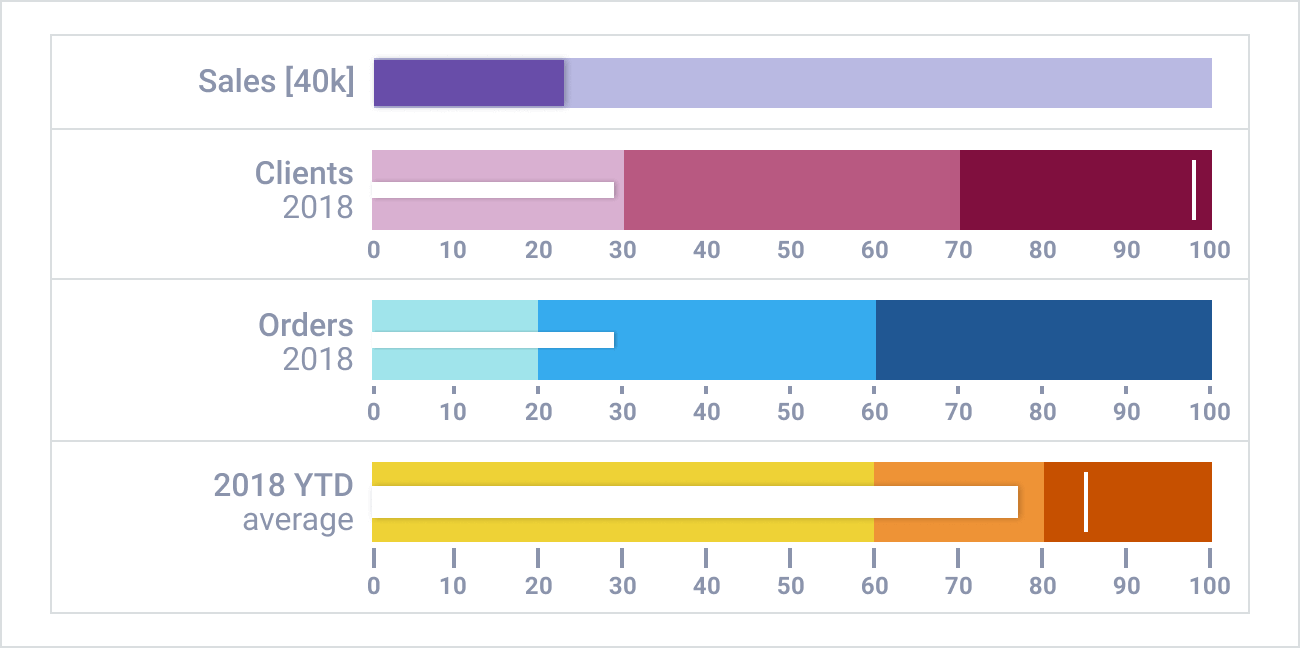
Bullet graph widget serves for efficient presentation of rapidly changing information, as well as for the creation of data-rich dashboards . This component has out-of-the-box design with smooth animation. A user can choose vertical or horizontal orientation depending on an app layout.
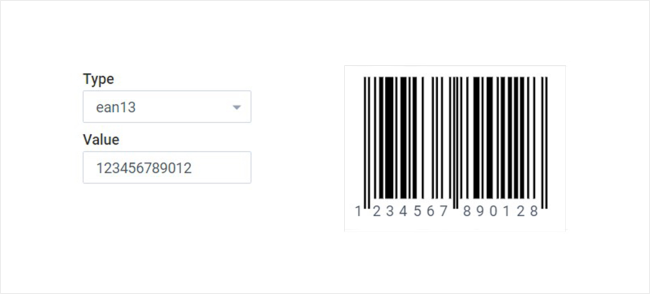
Barcode is a widget that displays text values in a machine-readable format. It provides an opportunity to easily embed generated barcodes into your applications. It includes three types of barcodes: EAN8, EAN13, and UPC-A. The width and the height of the barcode itself and the text are editable. Besides, there is a possibility to create a personal barcode.
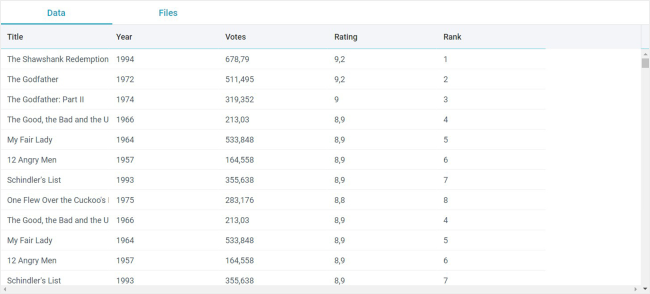
Excel Viewer is a tool for viewing Excel files. The files may be loaded by setting a remote/local URL or parsing the contents of an uploaded file by using the related Webix API. The widget is easily editable. The toolbar contains tabs that allow switching between sheets.
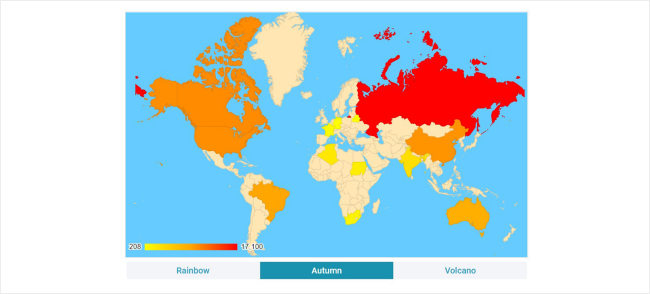
GeoChart provides integrating Google maps into any application. It may be used in developing visual analytical systems. All Google GeoChart settings are available. The data is loaded into GeoChart in JSON, XML, or CSV formats.
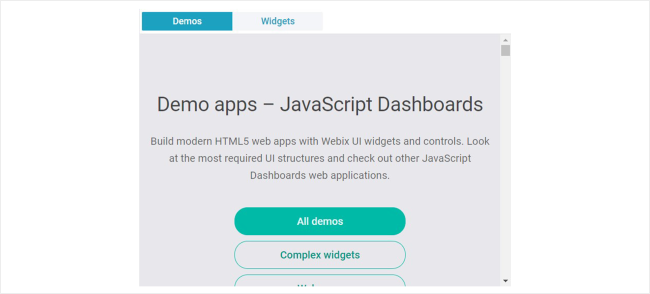
Iframe is one of the three widgets that allow adding HTML content to applications. It allows embedding any external documents and web pages to an application. Several web pages may be shown with the help of the widget. Easy navigation is also provided.
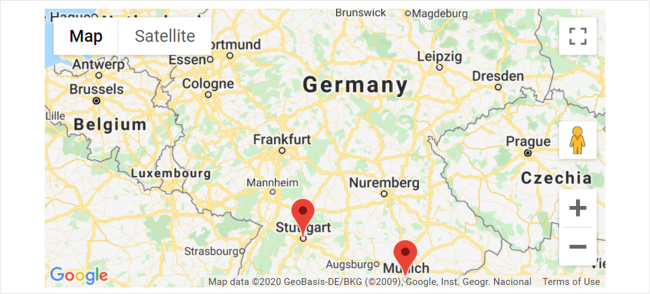
Map UI widget is based on Google Maps API. It is a handy tool for applications that intend to use geographical visualization. The widget supports four map types: roadmap, satellite, hybrid, and terrain. Markers and heatmap layers are customizable.
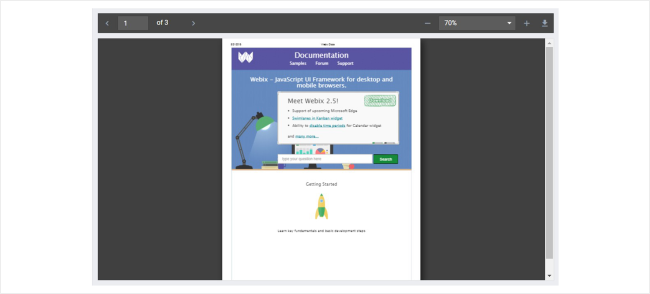
PDF Viewer provides the possibility of viewing PDF files into any web application. The PDF documents can be viewed, downloaded, and uploaded. The toolbar of the widget includes navigation arrows, the current page label, the "all pages" label, zooming buttons, and the download button. The public API allows using the toolbar separately from the viewer.
Template is one of the three widgets that allow adding HTML content to applications. There are four predefined types of Templates provided by Webix: with a thin grey border, borderless, "header" for parts of the app interface, and "section" from blocks of Form controls. The content of Template can be either plain text, or HTML markup with text, or a single data item. Template API allows setting the content dynamically.

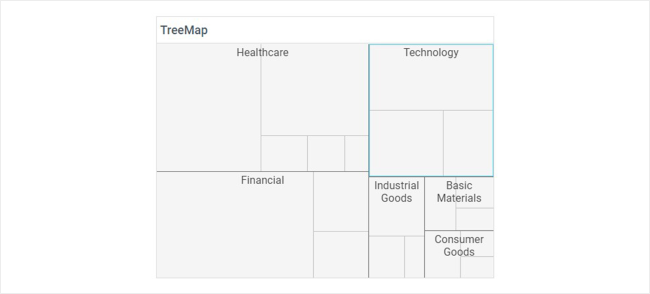
TreeMap allows you to present the data in a set of nested rectangles. It helps to arrange the information in a compact form. The widget is flexible, so any style may be applied. Clicking on each item allows displaying the child items, which adds to the compactness of the application.
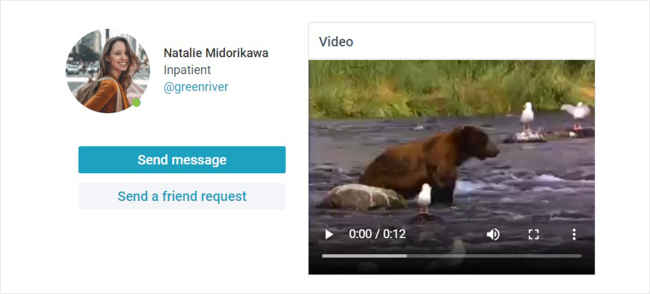
Video widget is one of the three widgets that allow adding HTML content to applications. The widget helps to embed video files into applications. It is based on HTML5 "video" tag and provides support for MP4, WebM, and Ogg video files. Video API is easily customizable.
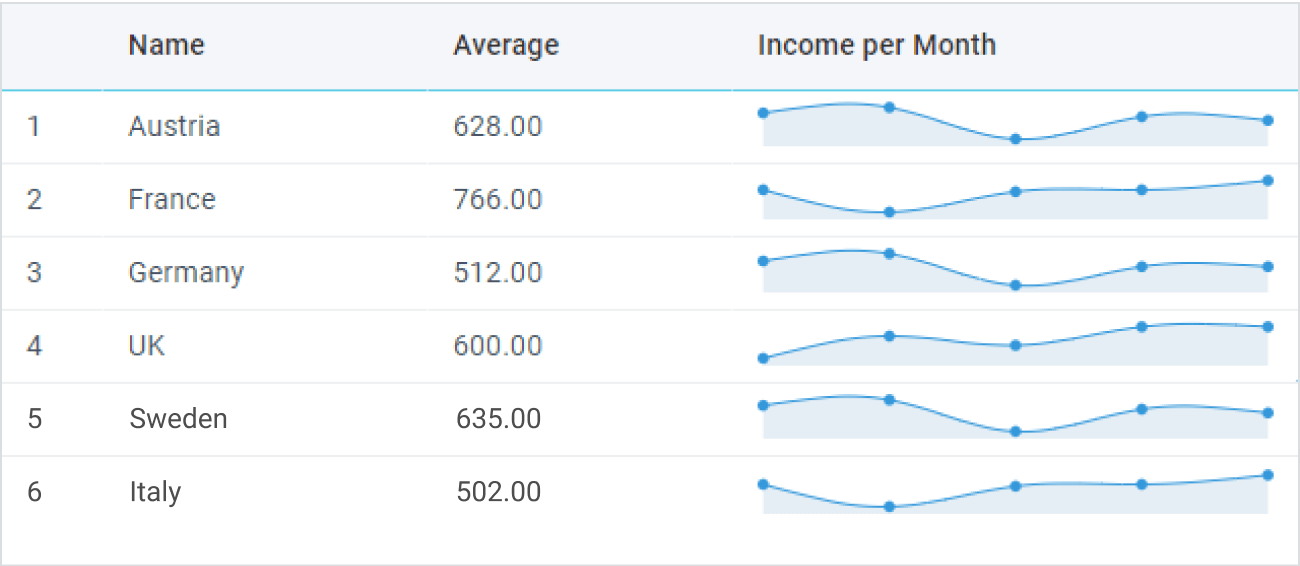
Data visualization feature of DataTable.
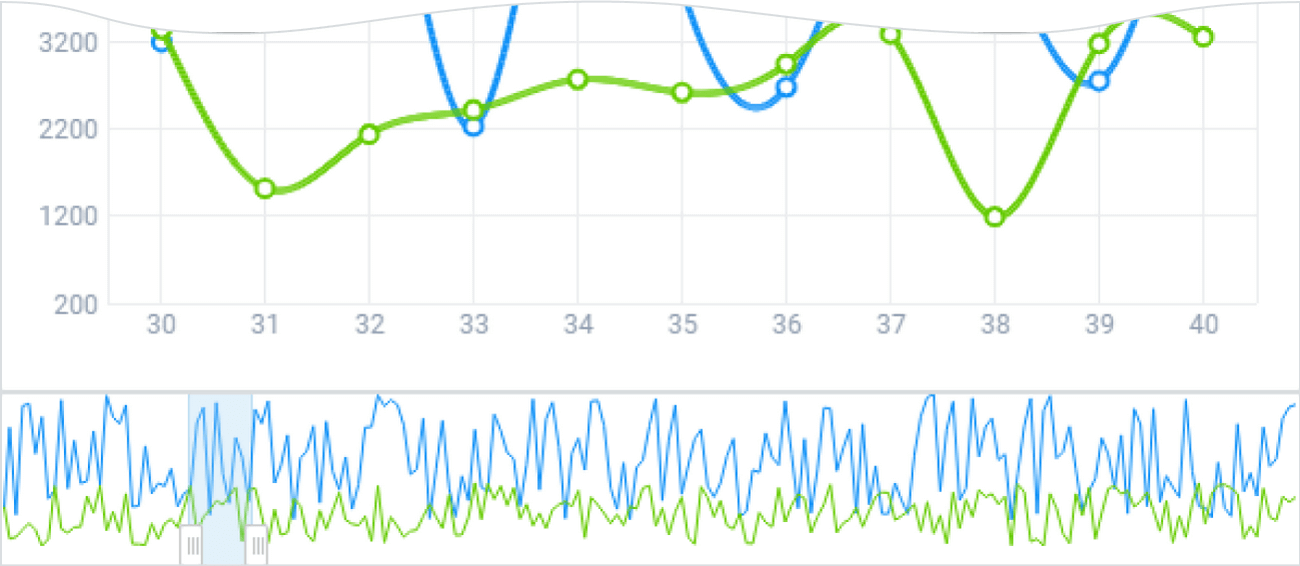
Range control tool for Chart widgets.
Integration with Third-Party Tools
Webix is a flexible and highly professional JavaScript library. You can easily integrate it with any third-party visualization tools.
Integration with Third-Party Charts
You can integrate Webix with a number of third-party charts. Check the documentation about JavaScript сharts integration.
Maps Integration
Webix allows embedding geographical maps into an app with the help of its own components. Read more about the integration with maps from different providers.
Google Maps
Yandex Maps
OpenStreetMap
HERE Maps
Integration with other graphic tools
Please, find more information about graphic tools integration here.
Create rich user interfaces with Webix UI library
- Quick Start
- How to Start
- Video guides
- Interactive tutorials
- Live demos
- Webix Tools
- Webix Jet
- UI Designer
- Skin Builder
- Form Builder


