-
Widgets
Other complex widgets


Webix Pivot Table & Pivot Charts features
New features Webix release brought
Data aggregation
Data export
Custom operations
Dynamic localization
Charts & visualization
Intuitive grid configuration
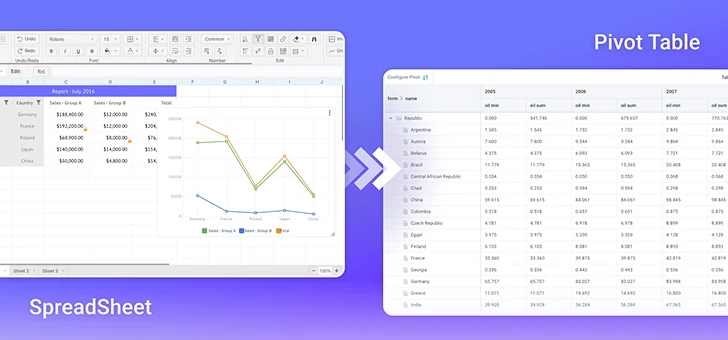
Data aggregation
Extract significant information from huge data sets. Easily
organize, summarize and compare complex data in 3 views: table,
tree, and chart.
Data export
Use ready-made Pivot Table and Chart structures and export them
to PDF, PNG, Excel, and CSV: suitable for business-critical
reporting.
Custom operations
Use pre-defined functions, write your own compound expressions
in complex function input fields or create custom functions for
data aggregation.
Dynamic localization
Change locales dynamically using methods and adjust dates,
numbers, monetary units and text labels associated with
particular countries.
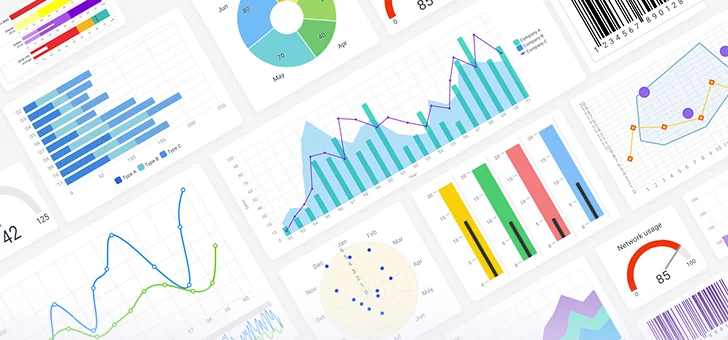
Charts & visualization
Choose the appropriate chart type (bar, line, spline, spline
area, radar, donut, and pie) to visualize, analyze, research and
compare complex data sets.
Intuitive grid configuration
Customize the Pivot's inner grid with familiar Datatable
settings and Pivot-specific features like min/max highlighting
for rows and columns.
Pivot Charts: Advanced Data Visualization
for Enterprise Apps
Webix Pivot Chart provides a powerful, enterprise-ready layer for
analyzing and visualizing complex datasets. It helps teams quickly turn
aggregated data into visual insights. Whether tracking KPIs, comparing
metrics across regions, or exploring trends over time, Pivot Charts
streamline complex data analysis.
Webix Pivot Charts advanced capabilities:

Visualize diverse datasets with multiple chart types
Choose the most effective data presentation form bar, line,
spline, area, radar, donut, and pie charts.

Seamlessly switch between Pivot table, tree, and chart views
Improve workflow by moving from tabular data to hierarchical
views or charts without duplicating data.

Analyze trends, compare metrics, and explore relationships
Find useful insights quickly with the Pivot Chart real-time
filtering, grouping, and aggregation.

Maintain full control over calculations on client or server
Get reliable behavior in production environments with large
datasets by defining aggregation
logic and formulas.
logic and formulas.

Make smarter decisions with real-time Pivot visualizations


Why Webix Pivot is enterprise-ready

Reduced technical and operational risk
Production-ready Webix Pivot supports high-load scenarios while
maintaining predictable performance, security, and stability for
mission-critical enterprise systems.

Scalable performance without compromises
Ensure scalable performance in complex enterprise architectures by
choosing where data can be processed: in the browser for speed or
on the server for large datasets.

Faster delivery and no vendor lock-in
Customizable UI and seamless back-end (Node.js, PHP, .NET) and
front-end (React, Angular, Vue) integration let Webix Pivot fit
internal workflows and design systems.

Predictable lifecycle and long-term support
The commercial license provides all advanced features and includes
long-term support, backward compatibility, and guaranteed
maintenance.
Webix Pivot coding samples


Start working with Pivot


Pivot JS Free Trial
Grab a 30-days free trial with technical support and start
creating rich user interfaces with Pivot JS just today.
Webix JS Pivot licenses & prices
Frequently Asked Questions
Does Webix Pivot combine Pivot Table and Charts possibilities?
Yes, Webix Pivot is a powerful tool to present summary reports in a structured, easy-to-read and visual format. It is built to work with aggregated data and transform complex datasets into clear, visual reports. Chart view provides visual insights that help identify trends, patterns, and outliers in data.
How do Pivot Charts work for data visualization?
Webix Pivot Charts are built directly into the Pivot component and allow users to visualize aggregated data without relying on external charting libraries. Users can instantly switch between table, tree, and chart views and export results to PNG, PDF, Excel, or CSV for business reporting and analytics workflows.
Is Pivot available in the free Community edition?
No. Like other complex widgets, the Pivot component is available only as part of the commercial Pro package. You can start with a free 30-day trial period and if it will not be enough to complete the evaluation, extend it by contacting us.
Is Webix Pivot suitable for production and enterprise use?
Yes. Webix Pivot is a commercial, enterprise-ready component designed for production use. It is fully customizable via API, includes long-term maintenance and professional support, and is used in business-critical applications. The commercial license is required for production deployment.
How can Webix Pivot be integrated into modern applications?
Webix Pivot integrates seamlessly with modern front-end frameworks such as React, Angular, and Vue, as well as with any back-end technologies including. It can be embedded into existing enterprise architectures without vendor lock-in.
Related blog posts
Create rich user interfaces with JavaScript Pivot